 ‹ Tilbake til artikler
Many of our customers rely on our penetration testing and red-teaming capabilities to test and verify their level of security. Our hackers normally emulate different threat actors based on the risk profile of the company being tested. Some of these projects rely on simulating the best threat actors in the world - nation states - which have the most advanced tools. An example of tools such as these are rootkits, which we will take a technical deep dive into. PwC's Red Team is ready to discuss our services, regardless of if you understand the technical details of this blog or not.
One of the biggest differences between pentesting and red team projects is that in pentesting one is testing the technical security controls in place, whereas the red team is actually testing the blue team. There are, however, different levels regarding the evolution of blue teams, which has nothing to do with their technical skills, but rather with the time they've had to evolve into more advanced detection capabilities.
One such advanced capability has to do with analyzing rootkits, which is malware running in the Operating System Kernel.
In this blog post, we will be operating under the assumption that you have retrieved a Windows kernel rootkit sample and want to breakpoint into the DriverEntry function, which is the equivalent of the main function in a normal executable file, but for the rootkit/driver. This might seem straight forward, and it is when you have the source code (technique #1) or the symbols for the payload (technique #2), but it’s not as straight-forward when you don’t have either (technique #3). The latter is typically the case when you need to analyze a malicious sample.
The lab and the sample
I’m doing remote kernel debugging which means I have a host Operating System (OS) and a target OS (Windows 10 version 22000, aka Windows 11) which is a Virtual Machine (VM).
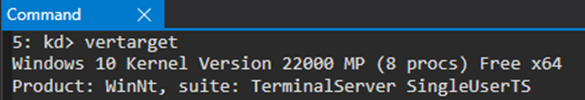
This specific OS has some peculiarities when it comes to installing it in a VM, which I’ll point out next.
This is not meant to be a walk-through the entire lab as it would become a blog post in itself. I’m only pointing out a few quirks on the setup. If you want to go deeper into the topic, I’d recommend the following, all by Pavel Yosifovich:
- Windows Kernel Programming
- "Windows Kernel Programming: Fundamentals" video course @ Pentester Academy
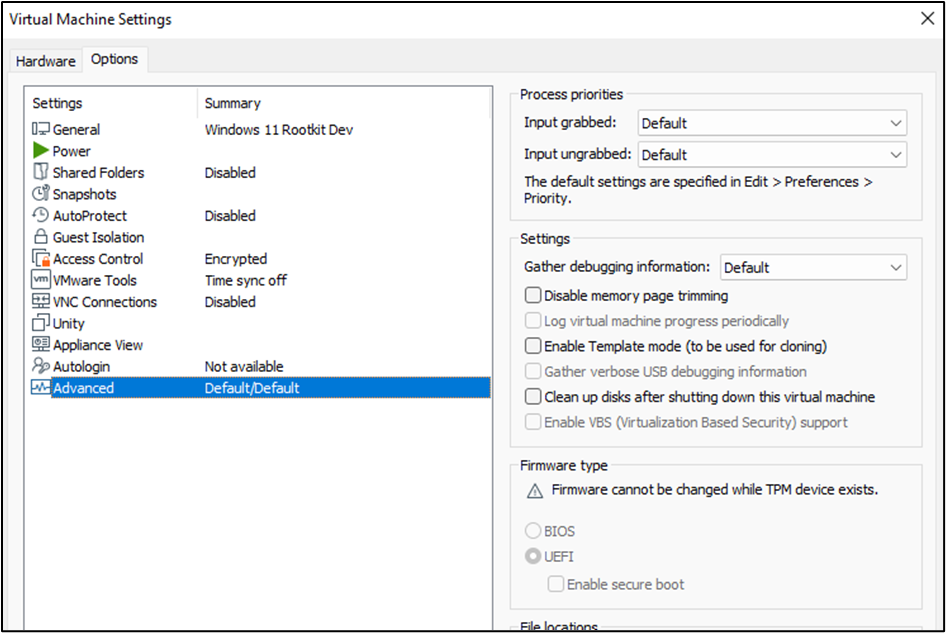
The virtualization software I’m using is VMWare Workstation 16 Pro and the VM settings are the following:
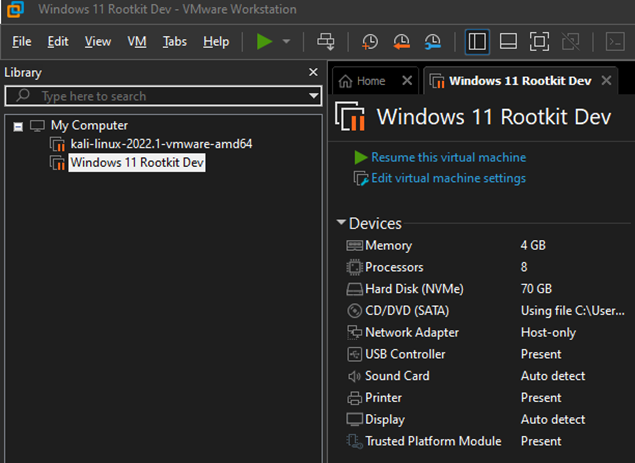
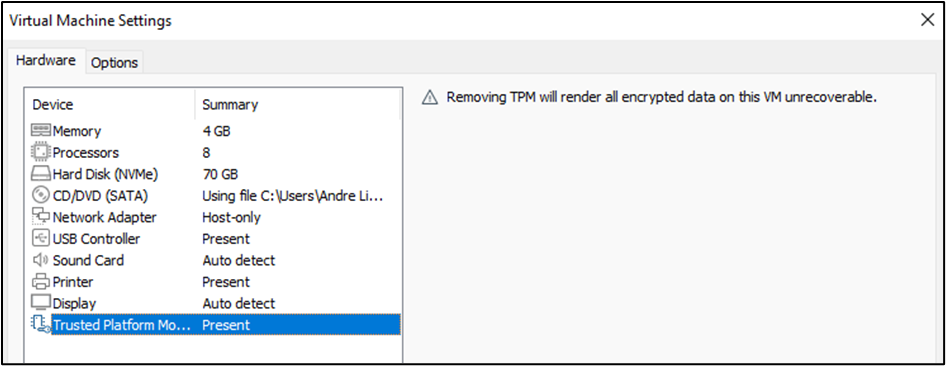
This is relevant if your target OS is Windows 11, which must follow a few requirements. When installing the OS, you’ll need to encrypt the VM, and add the Trusted Platform Module (TPM):
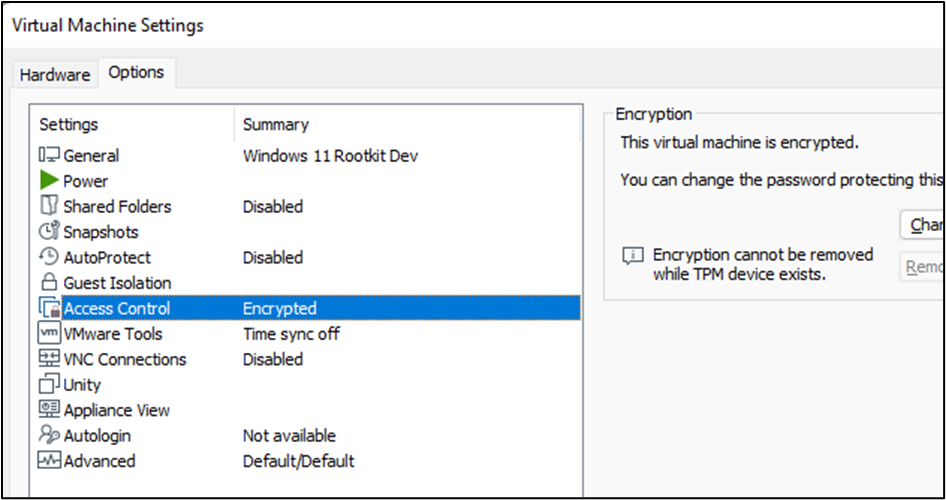
Now, while I did have the secure boot option enabled (bottom right of the screenshot below), when installing the OS, I did have to disable it in order to set up Windows debug mode.
 To set this up, in the target VM, you need to run the following commands:
> bcdedit -debug on
As mentioned earlier, this requires secure mode to be disabled, and it should be followed by a reboot.
From here on, it’s “business as usual” in terms of setting up the environment:
> bcdedit /dbgsettings net hostip:<ip> port:<port>
> bcdedit /set testsigning on
At this point, I’m using Windbg Preview to get the connection from the target OS.
Regarding the sample code, this is it:
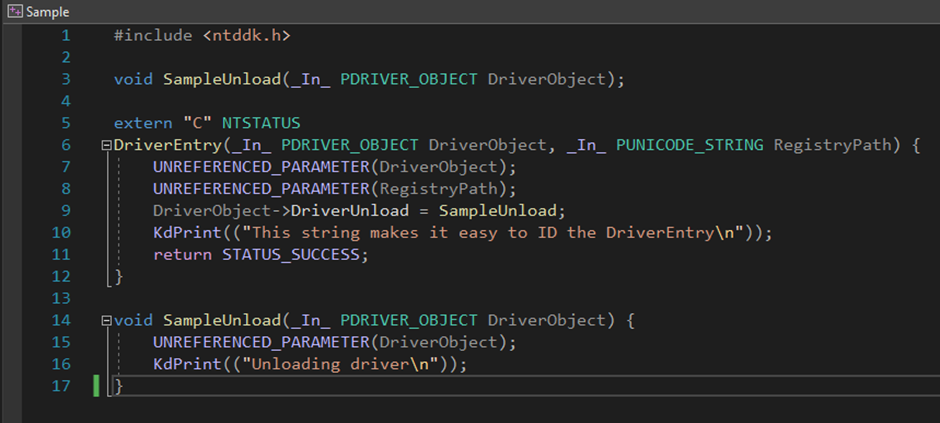 Technically, I could’ve simplified the code even more by not having the unload function, but it’s useful to unload and load the driver multiple times in the lab.
Technique #1 - __debugbreak()
As mentioned at the start, this is a very easy way to break at the beginning of the rootkit/driver. However, it assumes you have the source code.
This is quite useful if you’re testing your own code but next to useless if it’s malware you’re analyzing. This is due to the fact that whenever you retrieve a sample to reverse engineer, they pretty much never come with the source code.
So, how to go about it? Pretty straight-forward. You add the line “__debugbreak()” to wherever you wish to stop in the code and the execution stops there.
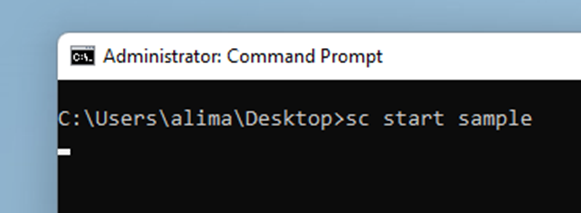
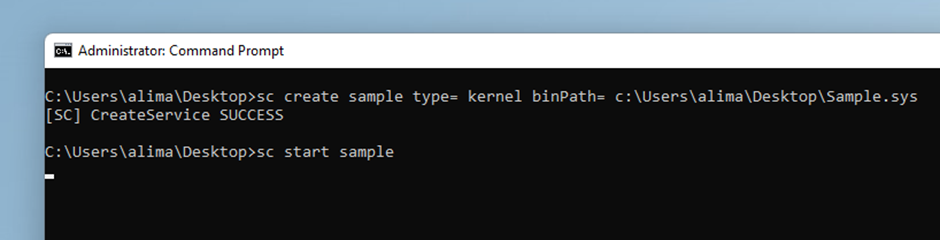
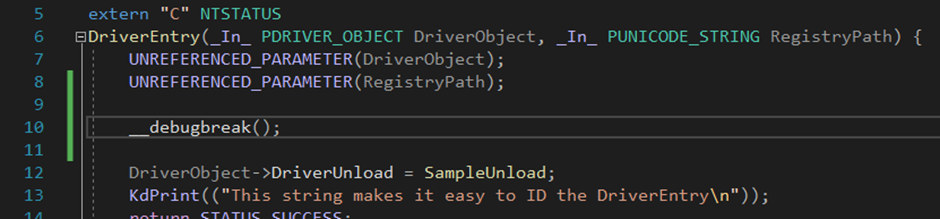 Recompile, move the .sys file into the target OS, and load the driver:
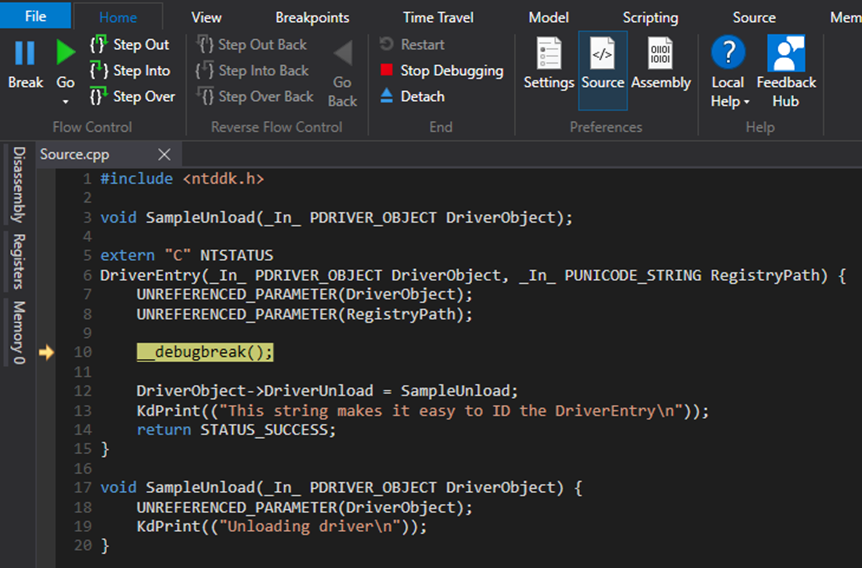
 Right after typing enter, on the last line, the OS freezes and when you move back to Windbg the debugger has stopped exactly where you want it.
Technique #2 - sxe
When “Set eXceptions Enable” (sxe) occurs, the target immediately breaks into the debugger before any other error handlers are activated. This kind of handling is called first chance handling.
More specifically, what we want to execute at Windbg is:
> sxe ld:Sample.sys
The “ld” stands for “load” and it’s relative to a module. This means that the break occurs when a module with this name is loaded.
To test this, we’ll revert back to the original simplified source code (without “__debugbreak()”), and we’ll also need the PDB file alongside the driver/rootkit sample. This is the disadvantage of using this technique as it is quite unrealistic to expect the analyst to have the matching PDB file when analyzing malware.
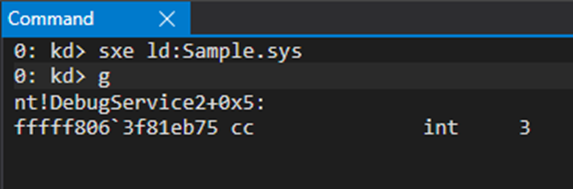
We then set the first chance exception for the load event relative to the module Sample.sys:
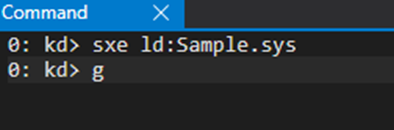
Then we load the driver/rootkit and the system will once again freeze, and we can move on with our analysis within the debugger.
If we look at the modules loaded (lm command) we can see the Virtual Address (VA) where the module has been placed in memory, and then use that as input to the “dh” (display header) extension command, which will interpret the Portable Executable (PE) file format and give us the entry point.
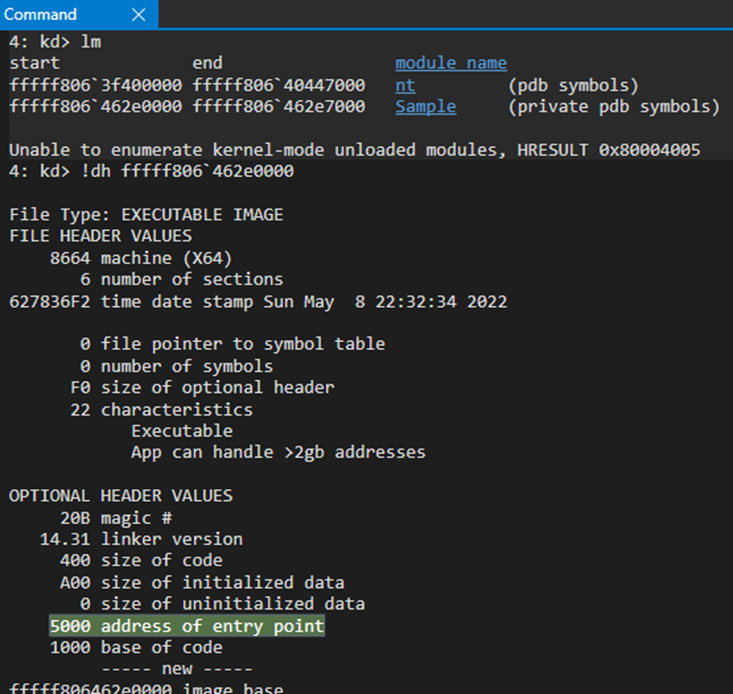
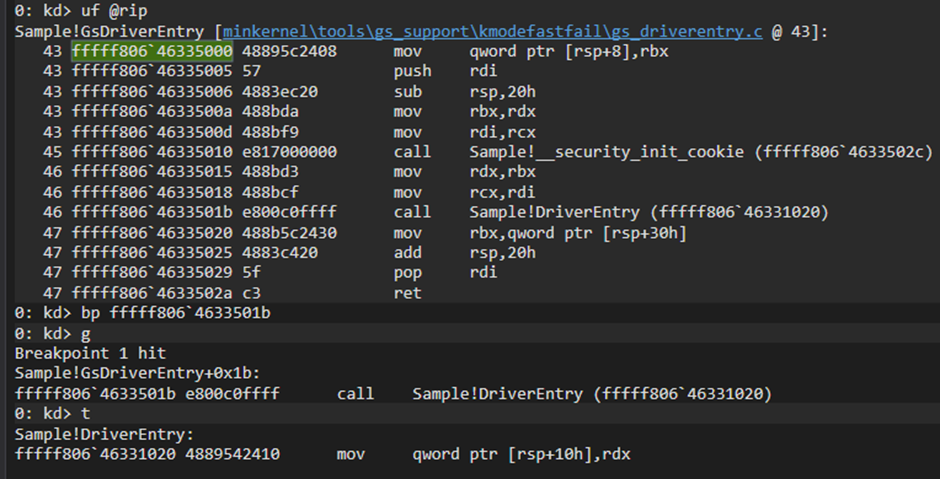
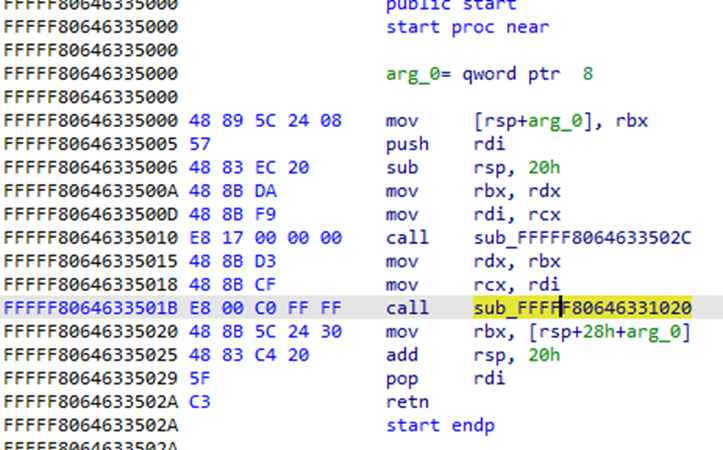
The entry point for a driver looks like the following (function “start” if you open a driver/rootkit with IDA) and will have two call instructions. The first sets up the stack cookie (GS option is the default in the compilation) and the second one is the actual DriverEntry which is the actual entry point from the programmer’s perspective.
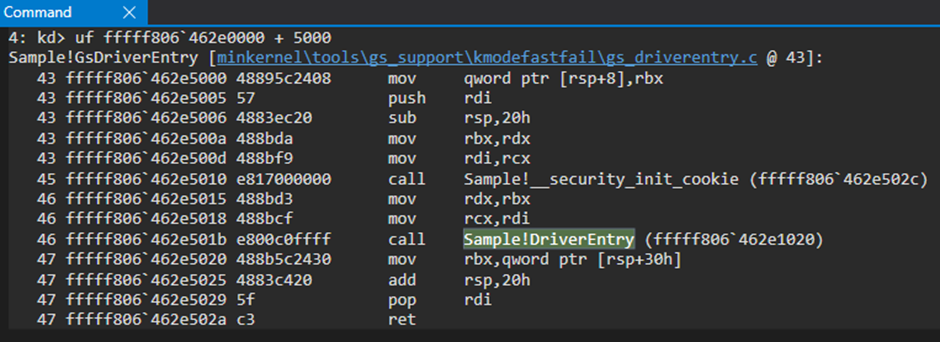 At this point all you need to do is set a breakpoint at that call instruction and step into it.
This scenario, as mentioned previously, is very unlikely though.
Technique #3 - IopLoadDriver or IopInitializeBuiltinDriver
This one is the most reliable technique in order to start the dynamic analysis procedure on a rootkit/driver. It consists of breaking at specific API functions which are used to load drivers in general, and navigate your way through a series of indirect calls and conditional jumps until you reach the DriverEntry() function.
So the first question is: which API function is responsible for this?
The answer can be retrieved from some analysis using for example technique #1, described previously, with the __debugbreak().
 After loading the driver and breaking at the start of DriverEntry, we can run a stack backtrace and see what’s being done by the Operating System.
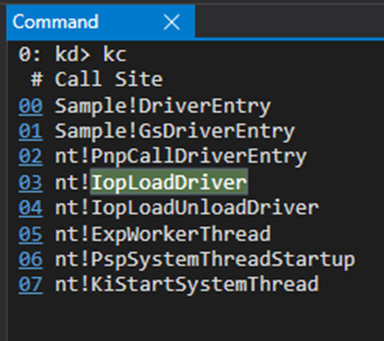
We could actually set a breakpoint at PnpCallDriverEntry (the first call that is not part of our module/rootkit/driver), but we’ll start from IopLoadDriver as it’s actually the one responsible for the loading and is consistent throughout older versions of Windows. Windows XP SP3, for example, had MmLoadSystemImage instead of PnpCallDriverEntry. But in Windows 11, our target OS, you could definitely start this process at PnpCallDriverEntry.
The “IopInitializeBuiltinDriver” is invoked to execute the same functionality as “IopLoadDriver”, but for built-in drivers.
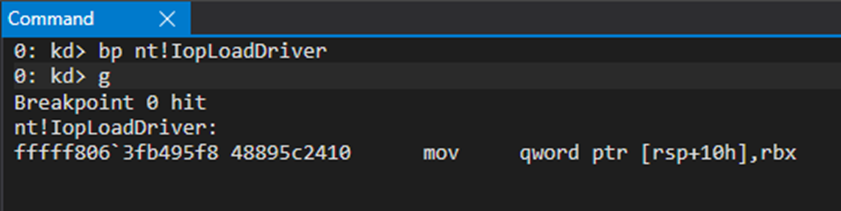
So now that we know where to put the breakpoint, let’s do so, but on the driver without the __debugbreak() to simulate a real-world scenario, and go from there.
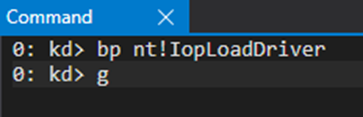
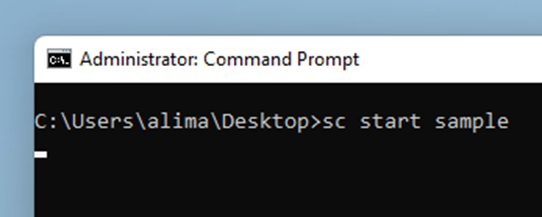
After these, the breakpoint is hit.
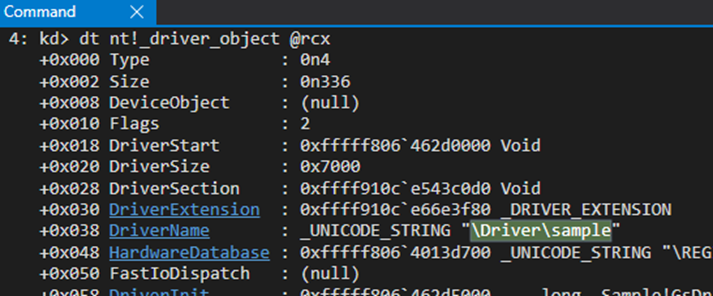
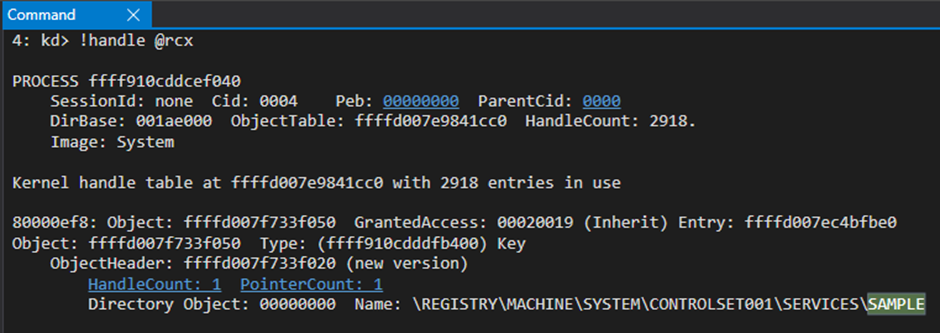
You should confirm this is the right IopDriverLoad as it could be possible that something else loads a driver at around the same time as you are doing so.
As it’s been reversed by the ReactOS team and many others, the first parameter to the function is a handle to the registry key of the driver, which will give out its name, and our confirmation that it’s the right driver loading.
 Now this function is quite big, so we’ll print out only the “call” instructions as we already know which specific “call” we are looking for: PnPCallDriverEntry, as per the stack backtrace.
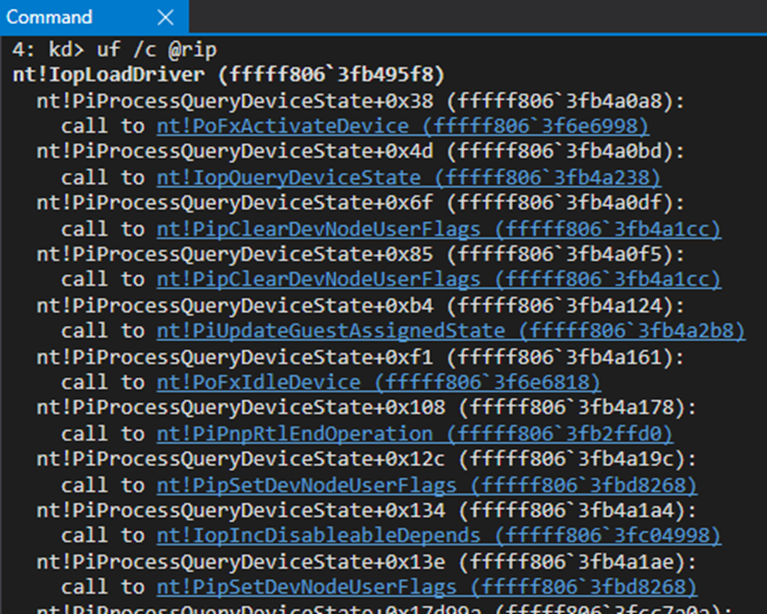
Going down the list we eventually find what we are looking for.
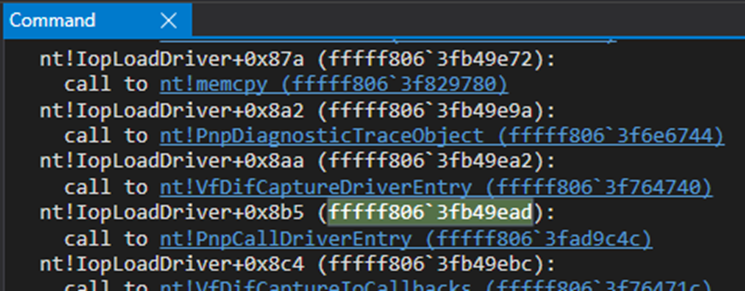
Next, we can step into it and then step into the second “call” instruction.
 If you were trying to make sense out of this and reversing this code from the beginning, you could look into the calls being made:
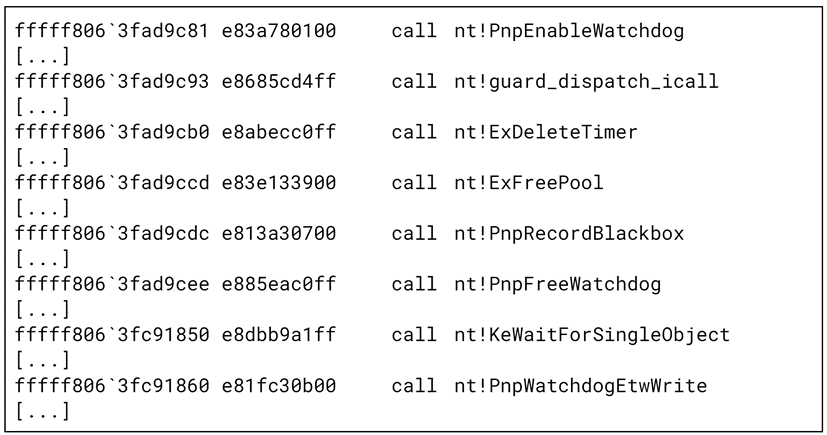
The first one is enabling Windows watchdog, a timer that is used to detect hardware or software lockups by counting down to zero. If it reaches zero, it will assume the system has frozen and will take corrective action. So it’s clearly not the “call” we are interested in. The ones after the second one seem to start a bunch of cleanup tasks, including deleting timers, and releasing dynamically allocated memory. So the second “call” would be a good bet regarding something interesting happening, as in, identifying where the DriverEntry function is located.
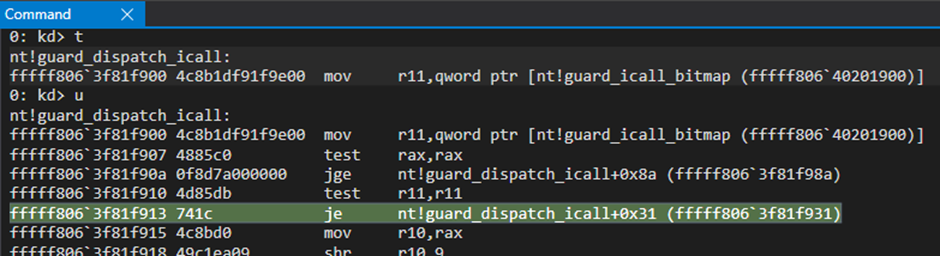
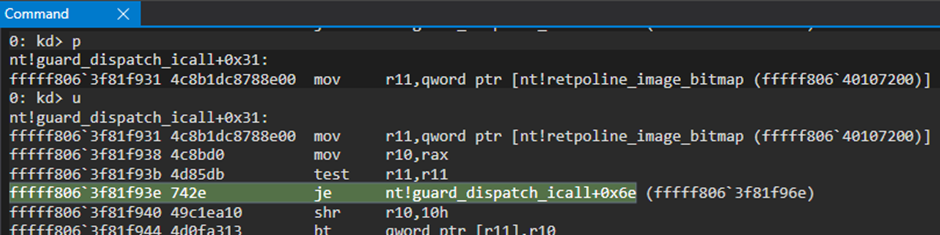
After stepping into the second “call”, it’s a matter of “looking around” until you realize where exactly to go from there on.
The “jump if equal” instruction will take you to the next step.
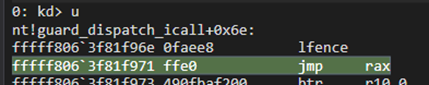
 After that jump, we find another one.
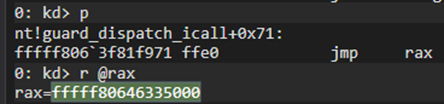
 And, finally, we get into the entry point of our module/rootkit/driver. Looking into the rax register, we can recognize from previous analysis, the 5000h offset (offset to the entry point).
Then what?
At this point, it’s usually up to each person’s preference, but it would be a good idea to run static analysis first, so you can get a general idea of what’s happening, and then synchronize the dynamic and static analysis to take advantage of each tool’s strengths.
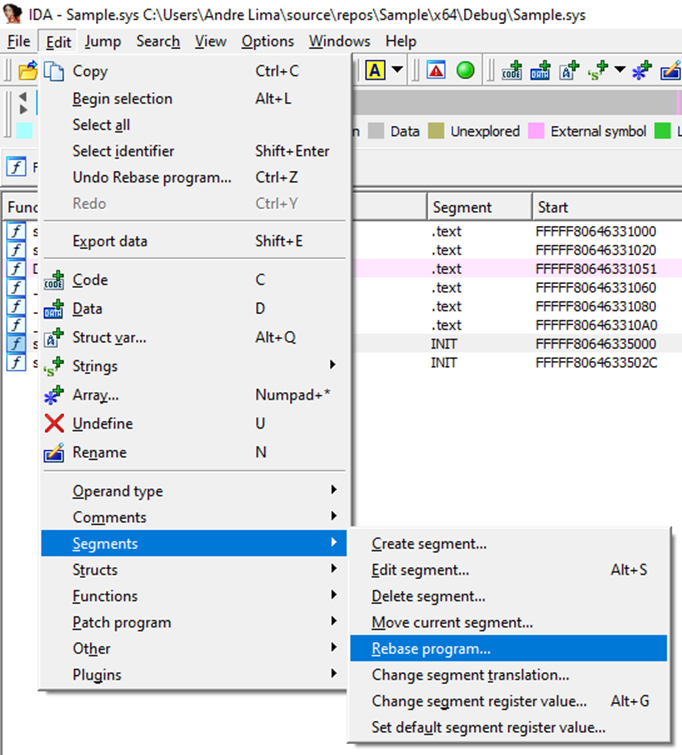
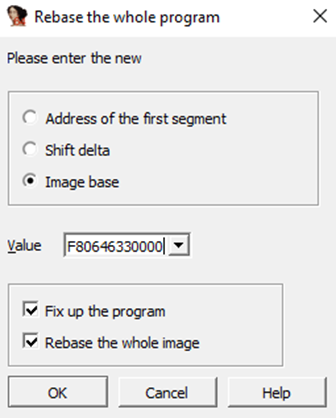
So I’d definitely start IDA (or whatever tool you prefer), open the “start” function, and rebase the program (Edit > Segments > Rebase program…) to have the VA addresses match on both IDA and Windbg.
At this point, after a few sessions in windbg, we can tell that the second “call” is the DriverEntry.
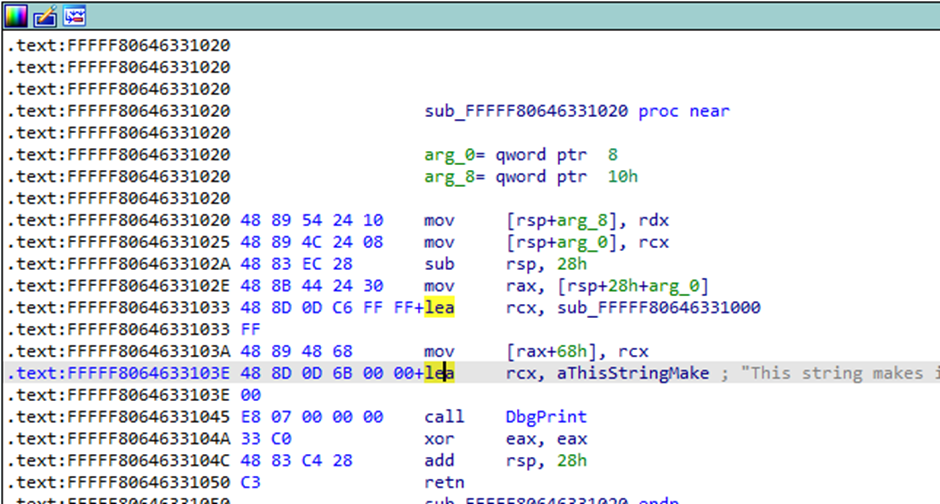 From here on it’s reversing as usual: renaming functions and local variables, setting software or hardware breakpoints, and figuring it all out. Not quite comparable though with a normal EXE/DLL, as drivers do have distinguishing features and analyzing them does require some level of knowledge regarding Windows Internals.
But at least you know how to start now :)
Legg igjen en kommentar